7 Psychometrics and Sampling
7.1 Psychometrics
In Section 6.4, I briefly mentioned that psychologists invented techniques (especially starting in the early 1900s) to help measure subjectively perceived things and other abstract psychological cónstructs. We call those techniques psychometric techniques, and the topic of measuring such psychological cónstructs is known as psychometrics. You will receive an entire course on psychometrics later in this degree program, but I will give you a gentle introduction to some of its fundamental ideas here (because repeated exposure and repeated recall are excellent ingredients to aid your learning).
An expert in psychometrics is known as a psychometrician.
Recall from Chapter 6 that IWO Psychologists are often interested in using quantitative methods to study one or more cónstructs and/or other variables. Before we can use quantitative methods to study those concepts, each of them must be measured in a manner that produces a numeric measurement. However, before we can numerically measure those concepts, we must clearly define each of the concepts we’re interested in.
In scientific research, two of the most common types of definitions for any cónstruct are: conceptual definitions and operational definitions. A conceptual definition describes the cónstruct in clear detail, to prevent other people from misunderstanding what the researcher means when they refer to that cónstruct.
If one of the cónstructs I’m studying is the performance of workers at ABC Company, I might provide this conceptual definition: “For the purposes of this study, the performance of workers at ABC Company is defined as the overall quality of all work-related behaviors and subsequent products and/or services produced by the workers”.
An operational definition describes the empirical evidence that the researcher will use as a measurement of the cónstruct. The process of creating an operational definition is known as operationalization. When we create an operational definition for a cónstruct, we say we’ve operationalized our cónstruct.
If one of the cónstructs I’m studying is the performance of workers at ABC Company, these are just some of the countless types of operational definitions I might choose if I want the data to be numeric:
“For the purposes of this study,
the performance of workers at ABC Companywill be operationalized asthe number of client reports delivered by the workers within the past 12 months.”“For the purposes of this study,
the performance of workers at ABC Companywill be operationalized asthe average of the performance ratings given by the workers' supervisors via our questionnaire.”“For the purposes of this study,
the performance of workers at ABC Companywill be operationalized asthe average of the performance ratings given by the subject-matter experts we recruited to review the workers' client reports.”
In general, there are almost always numerous (even countless) operational definitions that we could choose for any given cónstruct. Our chosen operational definition(s) can involve any of several popular types of measurement procedures:
- Self-report measure: The person being studied provides information about themself. For example, a worker might answer questions about themself.
- Other-report measure: A person provides information about someone else. For example, the researcher asks a supervisor to answer questions about an employee.
- Observational measure: This is technically just a type of other-report measure, in which the researcher or another trained observer or rater is the person providing the information. For example, a trained research assistant might observe how team members talk during a team meeting.
- Retrospective measure: A person provides information about something that occurred in the past. For example, a worker might answer questions about a performance event that occurred in the past month.
- Concurrent measure: A person provides information immediately while an event is occurring. For example, a worker might narrate what they perceive while they are observing something occur in the moment.
- Prospective measure: A person provides information now about a future event (which might be either purely hypothetical or very likely). For example, a worker may provide information about what they believe would be the impact on the workers’ attitudes if the company changed its scheduling policy.
- Physiological measure: Also known as biological measure: Information such as heart rate, eye movements, hormone levels, brain activity, etc., is collected.
Notice the types of measurement procedures listed immediately above aren’t necessarily mutually exclusive. For example, if you asked a supervisor to give you information today about a worker’s performance from the past month, that would be a retrospective other-report measure.
Furthermore, the operational definition that we choose for any cónstruct can have an influence on the scale of measurement (also sometimes called level of measurement) for our measure. The scale of measurement for any particular measurement process is simply a special description of the type of data that can be produced by that measurement process. In science—including IWO Psychology—the phrase scales of measurement typically refers to a specific typology of four types: 1. categorical, 2. ordinal, 3. interval, and 4. ratio. Perhaps the best way to explain those four scales of measurement is via examples, as described in Table 7.1.
| Scale of measurement | Example |
|---|---|
| Categorical: The variable’s data do not form a dimension. That is, they cannot be put into a logical sequence of increasing/decreasing essence of the variable. | The occupation type variable would be on a categorical scale of measurement if it had these types of data: engineer, marketer, accountant. |
| Ordinal: The variable’s data form a dimension, but the distance between each possible “level” along the dimension might not be equal. | The job satisfaction variable would be on an ordinal scale of measurement if it had these types of data: dissatisfied, somewhat dissatisfied, somewhat satisfied, satisfied. As you can see, those data form a dimension, but we cannot guarantee that the subjectively perceived “size” of the difference between dissatisfied versus somewhat dissatisfied is the same as the subjectively perceived “size” of the difference between somewhat dissatisfied and somewhat satisfied. A respondent might believe there is a small difference between the former, but a large difference between the latter. Another example would be a variable whose data are never, sometimes, usually, always. Again, we can’t guarantee that the subjectively perceived “distance” between each level is equal. |
| Interval: The variable’s data form a dimension, and the distance between each possible “level” is equal, but there is no natural zero (also known as a true zero). In other words, an interval scale cannot measure the true absence of the thing it is measuring (typically because the true absence is undefined for that thing). | The extroversion variable would be on an interval scale of measurement if it had this type of data: 0, 1, 2, 3, 4. As you can see, it would be measured on a 5-point scale from 0 to 4, and the distance between each “level” is equal. However, a score of 0 on that scale doesn’t mean the person has no extroversion, because there is no such thing as the complete absence of extroversion (i.e., it is conceptually undefined, because even the most introverted people interact with other people eventually). In other words, 0 merely denotes the lowest level on that scale (e.g., perhaps “very little extroversion”). Another example would be a performance rating variable on a scale of 0, 1, 2, 3, where 0 is very poor and 3 is excellent. Again, 0 on this scale doesn’t denote the complete absence of any performance at all, thus it isn’t a natural zero. |
| Ratio: The variable’s data form a dimension, and the distance between each possible “level” is equal, and there is a natural zero (also known as a true zero). In other words, a ratio scale can measure the true absence of the thing it is measuring. | The how many coworkers variable would be on a ratio scale of measurement if it had this type of data: 0, 1, 2, 3, … 99, 100, …. If the question is “how many coworkers do you have”, the datum 0 would indicate the true natural absence of coworkers if the person is self-employed. If the question is “how many coworkers are your enemies”, the datum 0 could truly represent zero enemies. Another example would be the number of correct answers on a hiring test variable. That type of variable could have a natural zero (e.g., none of the questions were answered correctly). |
In general, if a cónstruct is a dimension, you can choose whether you want to measure it via an ordinal or interval scale of measurement. But whether or not you can use a ratio scale of measurement depends on whether the dimension contains a natural zero (i.e., whether it’s possible to measure the true absence of that cónstruct).
The scale of measurement for any cónstruct will largely determine the types of analyses you can do on the data from your measurements. For example, if all of your data are on a categorical scale of measurement, then you won’t be able to compute a correlation coefficient nor perform a regression analysis (both of which are popular techniques you will learn in the statistics course later). In general, there are more types of numeric operations you can do on your data as you move up the ladder of scales of measurement: categorical data allow the fewest types of numeric operations; ordinal data allow more than categorical data allow; interval data allow even more; and ratio data allow the most. Thus, whenever you have the ability to choose your measurement process, you should typically choose the one that will allow you to have the highest scale of measurement.
Sometimes a researcher will have a good reason to intentionally choose an ordinal scale of measurement instead of interval or ratio. For example, if they are studying workers at a small company, the researcher might intentionally use an ordinal scale of measurement to measure age (e.g., 18–24, 25–34, 35–44, …) because they want to avoid making the participants feel like someone is going to be able to identify them in the dataset via a combination of their specific information (e.g., they might be the only 18-year-old person at the company).
7.1.1 Validity and Reliability
7.1.1.1 Validity
Two of the most important topics in psychometrics are validity and reliability (and, in fact, reliability is part of validity). In science—including IWO Psychology—it may seem like the word validity has a dizzying variety of meanings. However, there is a unifying fundamental meaning. To help clarify things, a good place to start is with a definition of validity from the Oxford English Dictionary:
The quality of being well-founded on fact, or established on sound principles, and thoroughly applicable to the case or circumstances; soundness and strength (of argument, proof, authority, etc.). (Oxford English Dictionary, 2025a)
Notice the above definition includes the adjective sound and the noun soundness. The same dictionary provides this definition of sound:
In full accordance with fact, reason, or good sense; founded on true or well-established grounds; free from error, fallacy, or logical defect; good, strong, valid. (Oxford English Dictionary, 2025b)
The same dictionary provides this definition of soundness:
The quality or fact of being in harmony with solid or well-established principles or facts. (Oxford English Dictionary, 2024)
Thus, in the domain of Psychology, a good definition of validity is:
the extent to which a structure (e.g., a tool or psychometric instrument) or process (e.g., a method or experiment) is well-founded on or in accordance with facts or reasonable principles, and appropriate for a specified context or purpose.
As you can see from that definition, the validity of any structure or process may depend on the principles you deem reasonable, and your specific context or purpose.
Using a poorly designed questionnaire on students in a classroom might be a very invalid process if my goal is to measure their extroversion, but it can be a very valid process if my goal is to teach them about the pitfalls of poor psychometric design!
Here’s another example: a new firefighter readiness exam is developed, and using it on experienced trainees is a highly valid way to accurately evaluate the trainees’ readiness for graduation. However, the exam is extremely expensive to administer, such that it is way above the city’s budget. In this case, the use of that exam is valid for evaluating the trainees’ readiness, but it is invalid for doing so within the city’s budget.
As you can see, the validity of these two procedures depends on the intended purpose in each context.
Especially in IWO Psychology, Table 7.2 highlights typical structures or processes for which we may want to evaluate their validity.
| Structure or Process | Example |
|---|---|
A measurement instrument or process for measuring a cónstruct X. |
We want to know the validity of using this psychometric instrument on members of our target population for obtaining an accurate measurement of work passion. |
A process for figuring out whether there is any causal influence of X on Y. |
We want to know the validity of our randomized controlled experiment’s design for figuring out whether giving verbal praise towards long-tenured employees will have a meaningful impact on their work motivation. |
The structure of a theoretical model X as a useful representation of reality. |
We want to know the validity of our JD-R model in terms of how well it fits the empirical data. |
The structure of an inference X, or a process for inferring X. |
We want to know the validity of the logical structure of our inference.” Another example: “We want to know the validity of our process for inferring the most common types of rewards in organizational contexts. |
A process for studying a topic X. |
We want to know the validity of using an ethnographic research method to study the emergence of conflict within teams. |
In the psychometrics course later in this degree program, you will learn about many different labels that psychologists created to describe the various types of evidence about validity, especially the validity of a measurement process (also known as measurement validity) intended to obtain accurate measurements.
7.1.2 Reliability
As I mentioned earlier, reliability (also known as consistency) is merely one part of validity. In all domains of Psychology, the concept of reliability is applied almost exclusively to measurement instruments and measurement processes. A good definition for measurement reliability (also known as the reliability of measurement) is this:
Indeed, the concept of reliability can be applied to other processes that aren’t about measurement, but it’s uncommon in IWO Psychology.
The extent to which a measurement process produces measurement data that are consistent with themselves or consistent with measurement data from other measurement processes measuring the same cónstruct or object.
An important distinction to keep in mind is that a valid measurement process must be reliable, but a reliable measurement process isn’t automatically valid. The truth of that sentence may be clearer when translated like this: an appropriate measurement process must be consistent, but a consistent measurement process isn’t automatically appropriate.
Imagine there is an emergency-responder readiness exam that consistently gives lower scores to women than men, because the exam’s scoring formula places a big emphasis on how many pull-ups the person can do. In this case, the process of using that exam may be reliable at producing the same score, over and over, for each examinee regardless of how many times they retake the exam, but that exam process is inappropriate (i.e., invalid) for evaluating the true readiness of the person to be an emergency-responder—because their job has virtually nothing to do with being able to do pull-ups!
A valid measurement process must be reliable, but a reliable measurement process isn’t automatically valid.
When scientists—including IWO Psychologists—want to collect evidence about the reliability of a measurement process, it’s perfectly normal to collect evidence that doesn’t completely address the validity of that measurement process. This is because it is often more straightforward to separately collect evidence that focuses on reliability and then separately collect other evidence that focuses on validity, rather than try to collect evidence that completely addresses reliability and validity together. For that reason, when examining the reliability of a measurement process, IWO Psychologists aren’t necessarily focused on whether the measurement data produced by the measurement process are accurate nor otherwise valid—because the validity of the measurement process and its measurement data will be evaluated later via a separate series of validation tests.
A validation study is a research project (i.e., a study) to evaluate the validity of a process for some intended outcome. A validation study would typically include several validation tests, to produce multiple lines of evidence.
In all fields of Psychology, including IWO Psychology, these are the most popular types of reliability:
- Reliability across two or more timepoints with the same measurement instrument and measurement process (also known as test-retest reliability, or consistency across time). For example: a psychometric questionnaire to measure a person’s cognitive abilities is administered today, and then again next month. We’d like to know how much the measurement data from the two timepoints are similar to each other. This is especially relevant when we are measuring something that we expect shouldn’t change much across the timepoints, such as an adult’s cognitive ability in the span of a year, or a person’s overall satisfaction with their life in the span of a month.
- Reliability across two or more measurement instruments or measurement processes:
- Reliability across two or more persons who are separately measuring the same object (e.g., a person, cónstruct, event, etc.) at the same time:
- Reliability across two or more raters who are each giving a rating at the same time (also known as interrater reliability). For example: Two raters are separately rating Alex’s performance at the same time. We’d like to know how similar their ratings are to each other.
- Reliability across two or more measurement instruments that are expected to be similar to each other:
- A special and very important type of this reliability is known as internal reliability (also known as internal consistency reliability). This specifically refers to the reliability across two or more items in a questionnaire that are all supposed to measure the same concept. In other words, the researcher is treating each item as a “separate instrument”, even though the respondent answers all items together in a single questionnaire. For example, if I have a psychometric questionnaire with 10 items that are each intended to measure a worker’s
job-satisfaction, I would want to know how much the data from each of those 10 items are similar to each other. One of the most common methods to calculate internal reliability is known as coefficient alpha (also known as Cronbach’s alpha, or Cronbach’s), which usually ranges from 0 to 1 (i.e.,
) where 1 represents perfect internal consistency. As a rule of thumb, a coefficient
- Another common type is called equivalent-forms reliability, which typically refers to the reliability between two or more multi-item psychometric questionnaires (or interviews) that we believe are equivalent to each other. For example: imagine we have two versions of a psychometric protocol to measure a person’s level of extroversion. We’d like to know how much the extroversion scores from both versions are similar to each other.
- A special and very important type of this reliability is known as internal reliability (also known as internal consistency reliability). This specifically refers to the reliability across two or more items in a questionnaire that are all supposed to measure the same concept. In other words, the researcher is treating each item as a “separate instrument”, even though the respondent answers all items together in a single questionnaire. For example, if I have a psychometric questionnaire with 10 items that are each intended to measure a worker’s
- Reliability across two or more persons who are separately measuring the same object (e.g., a person, cónstruct, event, etc.) at the same time:
In all fields of Psychology, including IWO Psychology, the concept of reliability is almost exclusively applied to numeric data. Thus, reliability is almost always expressed numerically as a single number called the correlation coefficient, typically denoted with the letter . A correlation coefficient is always somewhere between -1 and 1 (i.e.,
). For example, you might see
, or
. When
, there is no consistency at all among the measurement data. When
or
, there is perfect consistency among the measurement data. In Psychology—including IWO Psychology—we almost never see
nor
. In Chapter 8, I will describe how to calculate
.
7.2 Sampling: obtaining a sample from a population
After you’ve operationalized your cónstructs and you’ve described your intended measurement process to measure those cónstructs, you’ll need to figure out how you’re going to get access to the people or other things (e.g., events) you want to measure!
To talk about that, let’s get acquainted with some vocabulary.
In the vocabulary of math, a set is any collection of things, and the things in a set are called the elements of that set.
A group of people is a set whose elements are people. A collection of training programs is a set whose elements are training programs. A collection of emotions is a set whose elements are emotions.
A subset is a set whose elements all come from another set (called the superset of that subset).
The set of M.S. I–O Psychology students at this university is a subset of all the students at this university.
In the vocabulary of statistics (which is part of math), a population is any set we want to understand.
It could be the set of all biomedical startup companies in Alabama from the year 2000 to 2025, or the set of all nurses in the USA, or the set of all employee meetings that occur at ABC Company during this summer.
A sample is any subset of a population. In the vocabulary of statistics, an element of a sample is typically called a sample element, or a sample unit. The process of collecting a sample is called sampling. Ideally, sampling is carefully planned, typically with the goal of obtaining a sample that is similar to the target population you are interested in.
If your target population is the set of all biomedical startup companies in Alabama from the year 2000 to 2025, you could obtain a complete list of all of those companies, and then randomly select 100 from that list. Thus, you would have a sample of 100 such companies.
Recall from Section 2.2.2.1 I said scientists (including IWO Psychologists) typically seek to make universal statements that are true, and that most of the universal statements that scientists seek to make are about sets that contain such a large number of elements that it would be practically and/or literally impossible to observe every element of those sets to verify the truth of any universal statement about those sets.
Recall from Section 2.2.2.1: A universal statement is any expression that says a specified property is true for all elements in a specified set. For example, each of the statements in Table 2.2 is a universal statement because they each make a claim about all elements in a specified set.
Because we typically don’t have access to observe all of the elements of the large populations we are interested in, we typically study a sample from that target population instead of directly studying the population. Thus, we seek to make a good inference about the target population, based on the sample. One of the most popular techniques for using samples to make inferences about a target population is called statistics.
I will dive deeper into statistics in Chapter 8.
Sometimes, practitioners of IWO Psychology are hired to make inferences about the employees at a specified company. In that case, the target population is the employees of that company. If the company is small enough, the IWO Psychologist might have sufficient time and resources to conduct the study on all of the employees of the company. In that case, there is no need to select a sample. The IWO Psychologist already has data on their entire target population.
7.2.1 Population Parameters vs. Sample Statistics
In the vocabulary of the field of statistics (as a broad area of theory and praxis), a parameter is any numeric characteristic that describes a population, whereas a statistic is any numeric characteristic that describes a sample. Typically, we use sample statistics to try to estimate their corresponding population parameters, because we typically don’t have the ability to measure the entire target population.
As you can see, the word statistic has at least two meanings: it can be a number that describes a sample, or it can refer to the entire field of statistical theory and statistical praxis (i.e., the practice of inferring something about a target population, based on numeric summaries of samples).
If my target population is every employee at ABC Company, I might obtain a sample of 100 of those employees. Any numeric characteristic of the sample has a corresponding numeric characteristic for the entire company, as illustrated in Table 7.3.
| Sample statistics (n = 100 employees at ABC Company) | Population parameters (all employees at ABC Company) |
|---|---|
| Average level of extroversion across those 100 employees | Average level of extroversion across every employee at ABC Company |
| Highest salary across those 100 employees | Highest salary across every employee at ABC Company |
| Lowest salary across those 100 employees | Lowest salary across every employee at ABC Company |
| Combined total number of years those 100 employees have worked at ABC Company | Combined total number of years every employee has worked at ABC Company |
Ideally, we would like all of our sample statistics to match their corresponding population parameters (or at least be close enough). Any difference between a sample statistic and its corresponding population parameter is known as sampling error, which we will discuss further below.
7.2.2 Some typical methods for sampling
Almost always in science, the goal of sampling is to obtain a representative sample (also known as an unbiased sample)—that is, a sample that is similar to the target population on all characteristics that are relevant to our study.
When our sample isn’t representative of our target population, we say we have an unrepresentative sample (also known as a biased sample). The reason why we don’t want an unrepresentative sample is because we will have a greater amount of sampling error—recall earlier in this chapter I said sampling error is the difference between any sample statistic and its corresponding population parameter. Any time we are using a sample instead of our entire target population, we are practically guaranteed to have some amount of sampling error. However, there are things we can do to try to minimize the amount of sampling error in our sample.
In case you’re curious… We almost never know any of the parameters of our target population, because typically the only way to know that is by directly observing/measuring our entire target population (and, if we were able to do that, we probably wouldn’t be using a sample in the first place). Without knowing the parameters of our target population, we can’t directly calculate the sampling error in our sample. However, we can try to estimate the amount of sampling error in our sample by using statistical techniques that are beyond the scope of this textbook. If you are curious to learn about how to estimate the sampling error, you can either wait until you take the statistics course next semester, or you can learn about it in any decent statistics resource on the internet.
One of the best ways to minimize the amount of sampling error in our sample is by using any sampling method that is likely to produce a large representative sample.
To help us select a large representative sample, there are two different categories of sampling methods: one is called known-probability sampling, and the other is called unknown-probability sampling. I discuss both of these in the following two subsections.
7.2.2.1 Known-probability sampling
In known-probability sampling (also known as random sampling, probability sampling, or probabilistic sampling) we typically must have a sampling frame, which is a list that represents everyone in our target population.
For IWO Psychologists, the most common situation in which you might use known-probability sampling is when your target population is the workers at some specified company or other type of organization. Otherwise, if your target population transcends any specific company (e.g., “all nurses in the USA” or “all working adults in Western cultures”), it becomes practically unfeasible to obtain a sampling frame. In that case, you would need to use unknown-probability sampling, which I describe in Section 7.2.2.2.
If your target population is every employee at ABC Company, your sampling frame could be a list of the names of each employee. If your target population is all of the meetings that occur at ABC Company this year (because your study is focused on making an inference about meetings, rather than just about employees), then your sampling frame could be a list of every meeting that occurred this year at ABC Company.
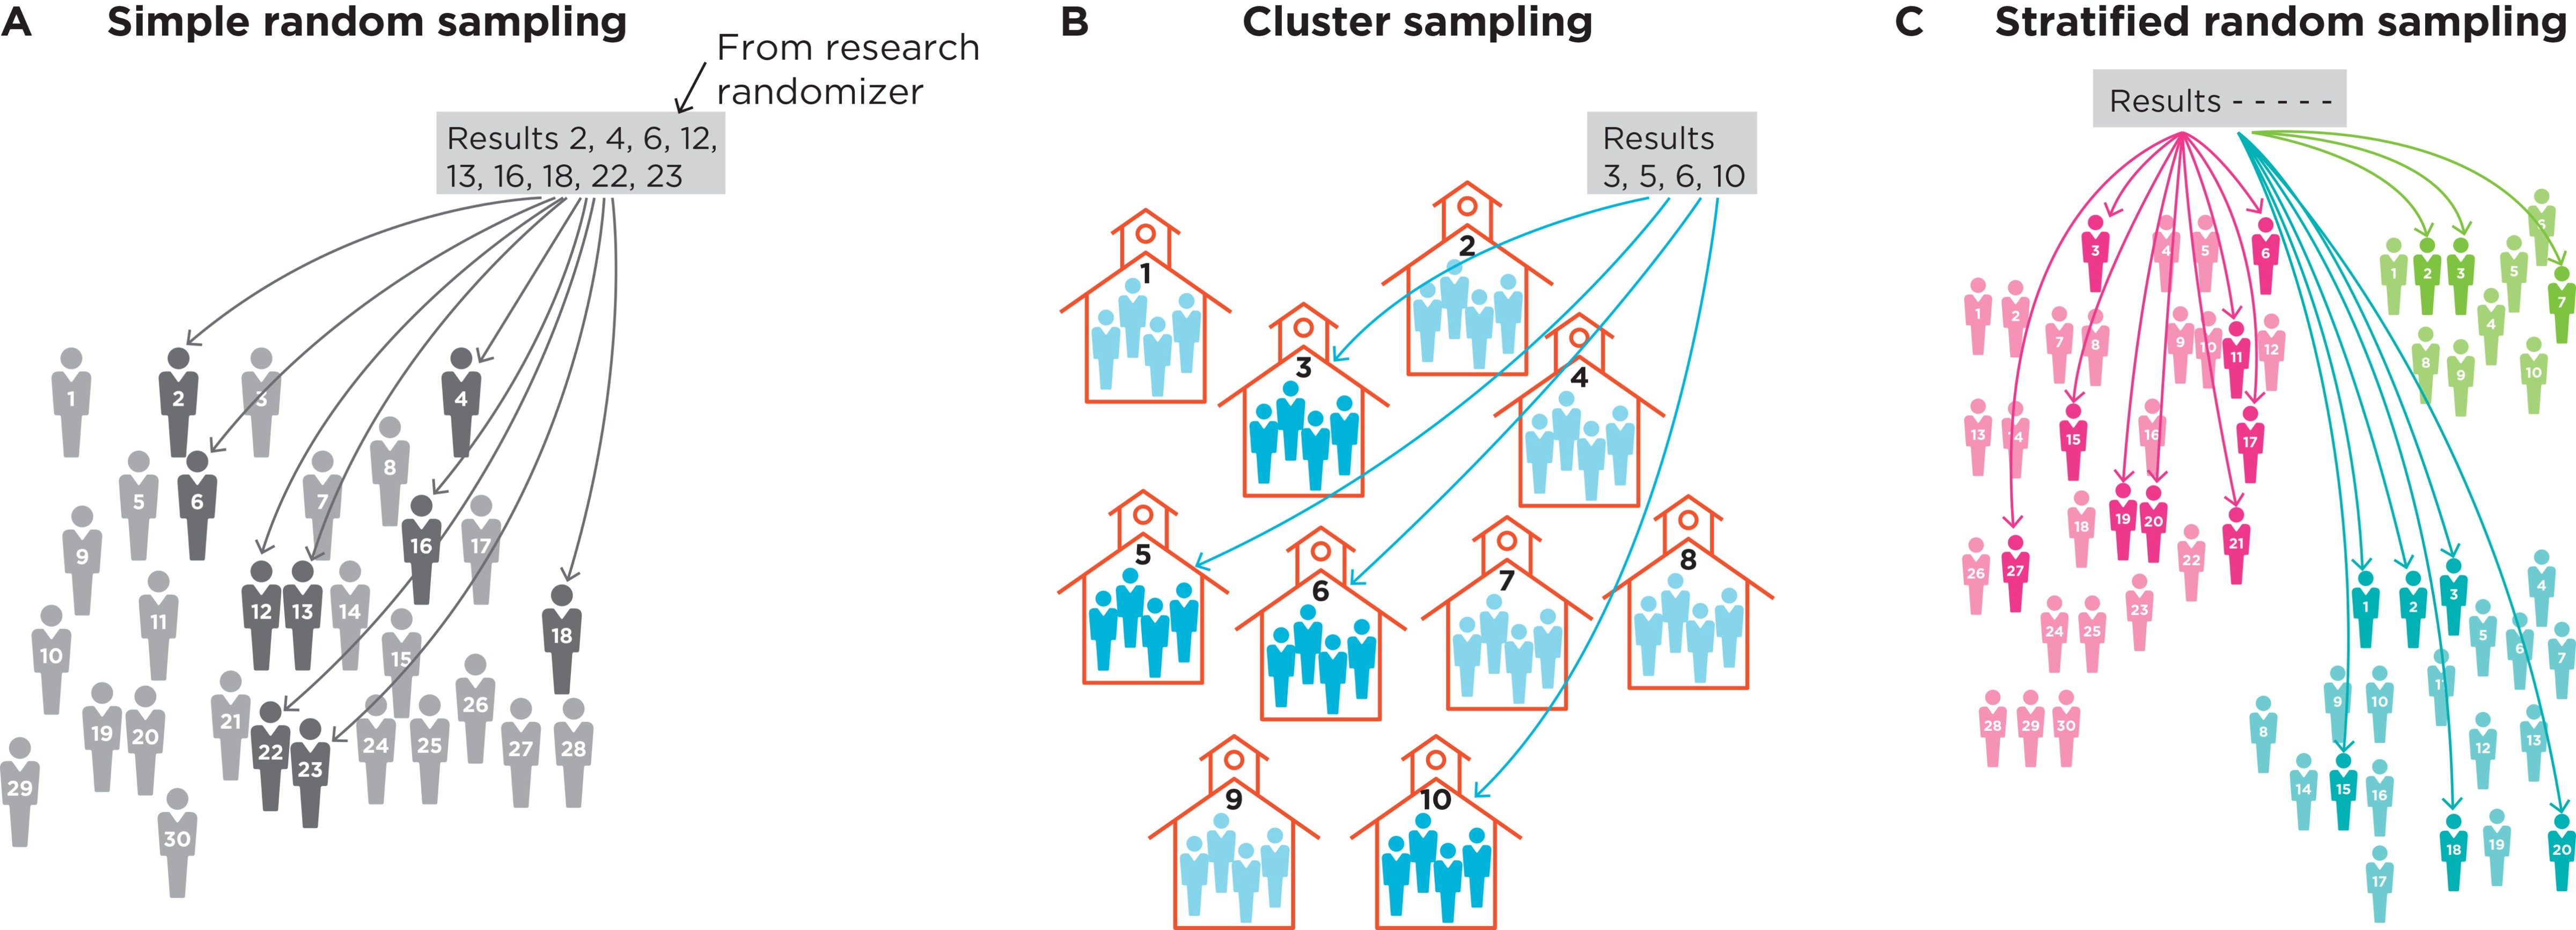
When you have a sampling frame, one of the simplest and effective sampling methods to obtain a representative sample is called simple random sampling (often written as: SRS) without replacement (depicted in panel A of Figure 7.1). It is effective because it ensures everyone in the target population has an equal probability of being included into the sample. Simple random sampling can be achieved with any computer program that generates a random integer. You would assign a unique integer as an ID number to each element of your sampling frame (e.g., 1, 2, … 700). Then, each time you generate a random integer from the computer, that will be the element ID in your sampling frame that you must select to be included into your sample. You would continue generating a new integer and adding that element into your sample until you reach your desired sample size.
If your sampling frame contains 700 people, and the computer-generated random integer is 23, then you must include into your sample the 23rd element from your sampling frame. Then you generate a new random integer and continue adding the corresponding element from the sampling frame until you reach your desired sample size.
Before the ubiquity of computers, people would use special books that contained large lists of random numbers, and that’s how the person would select a random number.
Another excellent known-probability sampling method (when you have a sampling frame) is called stratified sampling (also known as stratified random sampling, or stratified probabilistic sampling)—depicted in panel C of Figure 7.1. In that method, we use one or more stratification variables to divide our target population’s sampling frame into mutually exclusive groups (called strata, which is plural for stratum), such that any given element belongs to one and only one stratum. Then we randomly select elements from each of those strata. We could use any characteristic(s) of our sampling frame as the stratification variable(s) (e.g., gender, ethnicity, age, income bracket). We must also decide whether we want the number of elements in each stratum of our final sample to be proportional to their numbers in the target population (called proportional stratified sampling), or not (called disproportional stratified sampling).
If you want to use more than one stratification variable (which is known as cross-stratification), you would first organize your sampling frame according to the first stratification variable’s strata (e.g., age brackets), and then within each of those strata you would organize the sample elements according to the second stratification variable’s strata (e.g., income brackets).
Either way, when using stratified sampling, it is very important that the stratification variable(s) you select are meaningful for the variables you ultimately want to make an inference about.
One of the main advantages of stratified sampling (especially proportional stratified sampling) is that it helps us avoid ending up with a sample that is missing sample elements from any given stratum. In other words, by taking a random sample from each stratum, we ensure that no stratum is missing from our sample—thus helping to ensure our sample is more representative of our target population than not.
If we wanted to use income bracket as our stratification variable, first we would need to know the income bracket of each element in our sampling frame. Then, we would organize our sampling frame according to those income brackets. Then, from the first income bracket, we would randomly select multiple elements to be included into our sample. Then we would move on to the next income bracket and randomly select multiple elements from that one to be included into our sample. We’d continue likewise until we’ve gone through each income bracket.
If we want the proportions of elements in our final sample per each stratum to match those of the target population’s strata, then we’re aiming to do proportional stratified sampling. However, if we want our sample’s proportions to be something different than the population’s proportions, then we’re aiming to do disproportional stratified sampling.
Another good known-probability sampling method is called cluster random sampling (also known as cluster sampling, or probabilistic cluster sampling)—depicted in panel B of Figure 7.1. In that method, the elements in our sampling frame can be conceptually organized into mutually exclusive clusters, such that any given element exists in only one cluster. Depending on what the sample elements are (e.g., employees, meetings, or other events) the clusters can be based on anything (e.g., departments in a company, or days of the week if your sample elements are events). In one-stage cluster sampling, we randomly select a cluster and then we include all of its elements into our sample. We continue randomly selecting a new cluster and adding all of its elements into our sample, until we reach our desired sample size. Of course, some clusters won’t end up into our sample. In two-stage cluster sampling, after we randomly select a number of clusters, we then randomly select a subset of elements within each cluster, rather than including the entire cluster into our sample.
A common scenario in which you might use cluster random sampling is when your sampling frame doesn’t have detailed-enough information for you to randomly select individual sample elements, but you know your sampling frame can be organized into mutually exclusive clusters. However, the ability of cluster random sampling to produce a representative sample is decreased if the clusters have very different sizes.
Imagine we wish to sample 100 employees from ABC Company’s 700 employees, but the company is struggling to create a list of every employee. Without such a list, we can’t do simple-random sampling nor stratified random sampling, but we can do cluster random sampling.
If we know that each employee is officially part of only one of 12 departments at ABC Company, we can treat each department as a cluster. We would assign an integer ID (e.g., 1, 2, …, 12) to each department, and then use a random integer generator to randomly select departments. For each department that is selected, we would include into our sample everyone from that department. Then we would generate a new random integer and add everyone from that department. We would continue until we’ve achieved our desired sample size. Of course, some departments won’t end up into our sample.
As another example, if we know each employee has only one of 45 official job titles at ABC Company, we can treat each job title as a cluster. We would randomly select job titles (using our random integer generator as explained in the preceding example) and then we include into our sample everyone from the randomly selected job titles. We would repeat until we achieve our desired sample size. Of course, some job titles won’t end up into our sample.
Lastly, keep in mind you can combine several of the known-probability sampling techniques. For example, you could use two-stage cluster sampling to randomly select several clusters, and then within each cluster you can use stratified sampling to randomly select elements within each of the strata in each cluster.
There are many other known-probability sampling techniques, but I’ve described here the most common ones you may encounter in IWO Psychology. If you are curious to dive deeper, consider reading Lohr (2021) and Chaudhuri and Stenger (2005).
7.2.2.2 Unknown-probability sampling
When we don’t have a sampling frame, we won’t know the probability of selecting any given element of the target population, and we certainly can’t ensure that each element will have an equal probability of being selected. In that case, our only option is to use any of the unknown-probability sampling methods (also known as nonrandom sampling, nonprobability sampling, or nonprobabilistic sampling).
As I described earlier, in IWO Psychology the most common reason why we wouldn’t have a sampling frame is because our target population transcends any specific company (e.g., “all nurses in the USA” or “all working adults in Western cultures”), which makes it practically unfeasible to obtain a sampling frame. Whenever we don’t have a sampling frame, we would need to use unknown-probability sampling.
In IWO Psychology, the most common type of unknown-probability sampling method is called convenience sampling (also known as opportunistic sampling). In that method, we simply include into our sample whomever/whatever population elements we have access to. Typically, we would specify a set of eligibility criteria, which is a set of attributes that we want our sample elements to have, and we would screen our potential sample elements to filter out any elements that fail to meet our eligibility criteria.
The usage of the word screen or screening to connote filtering out comes from the usage of mesh metal sieves (also known as mesh screens) that allow small objects to fall through the holes in the mesh, thus allowing the user to separate objects from a heterogenous mixture. For example, this is often used to separate seeds from juice (the juice flows through the mesh, whereas the seeds are trapped by the mesh because they are too big to flow out of the holes).
Our eligibility criteria could be as broad as “any working adult” or as narrow as “any nurse who works full-time in any public hospital in the Southeastern USA”.
If we post an announcement online (e.g., on social media) to try to recruit participants, that is still convenience sampling because we are seeking eligible participants who happen to be available to us because they happen to see our announcement.
One type of convenience sampling is known as quota sampling. In that method, we would specify two or more categories of elements we wish to have into our sample, and then we specify how many elements (i.e., a quota) of each category we want to end up with into our sample. Then, we use convenience sampling until we obtain our desired number of sample elements for each category. Each category can have a different quota.
Keep in mind an important difference between stratified sampling versus quota sampling: in stratified sampling, elements of the population are randomly selected from each stratum. In contrast, in quota sampling, the elements from each category are selected by convenience—which is technically not random.
When using quota sampling, it’s up to the research designer to figure out what the categories should be, and how many elements are desired for each category (they don’t all have to be the same amount). For example, you might decide it’s important for your study to include 30 workers from the healthcare industry, 30 workers from the tech industry, and 30 workers from education. Or you might decide you want to select a different number of workers in each of several age categories to match the relative proportions published in the U.S. Census.
A third type of convenience sampling that is common in IWO Psychology is known as snowball sampling. In that method, we would seek sample elements just like we would normally do in convenience sampling and/or quota sampling, but then we would use those first-round sample elements to help us find more sample elements (i.e., 2nd-round sample elements), and then we might use those 2nd-round sample elements to help us find even more sample elements. The pattern would continue until we reach our desired sample size.
The phrase snowball sampling comes from the fact that snowballs grow in size as they roll down a snowy hill. Likewise, the sample size grows as each sample element is used to discover even more sample elements.
The most traditional example of snowball sampling would be asking participants to convince their coworkers (or acquaintances, or friends, etc.) to also participate in the research. However, snowball sampling can also be used when the sample elements aren’t people, as long as the elements are connected to other elements in some way—but those situations are rare in IWO Psychology.
7.2.3 How big must your sample be?
The field of statistics is currently somewhat bifurcated into two separate approaches: frequentist statistics and Bayesian statistics. Frequentist statistics is classic, and most students are taught frequentist statistics by default. Today among statisticians, Bayesian statistics has arguably acquired equal status (possibly greater status), but most students aren’t taught Bayesian statistics—because it’s still relatively new and most professors were never taught it.
In frequentist statistics, there is a technique known as power analysis in which you can calculate the minimum sample size that would be required if you want to achieve a sufficiently high probability of detecting the effect you are testing (conditional on several assumptions). In Bayesian statistics, there are analogous concepts that are similar to frequentist power analysis. Both of those techniques are relatively straightforward, but they are beyond the scope of this general research methods course. You can learn about frequentist and/or Bayesian techniques for estimating required sample sizes via any good internet resource about statistics. For power analysis, you might consider reading Muthén and Muthén (2002) as a practical introduction.
7.3 A reminder about pre-registration…
In quantitative research, IWO Psychologists carefully plan out the details of any study before they start collecting empirical data or committing to a “point of no return”. During that planning phase, the IWO Psychologist would specify details such as who their target population is, what the theory and hypotheses are, what their conceptual definitions and operational definitions are, how they’re going to measure their cónstructs, how they’re going to sample, how much sample they need, etc., etc.
It is often a great idea to pre-register those plans as soon as possible, so that you have publicly verifiable time-stamped evidence that you didn’t secretly HARK (see Section 2.4).
7.4 Suggested Readings
Zickar’s (2020) article is an easy-to-read yet deeply insightful overview of how to create a valid psychometric questionnaire.
You will take a Statistics course in this degree program, but if you are eager to learn more about statistics before taking that course, here are some books I can personally recommend: